A Century of a Volatile Gold-Silver Price Ratio
Comparison of the two metals' earthly scarcity gives no clue on what a stable price ratio should be

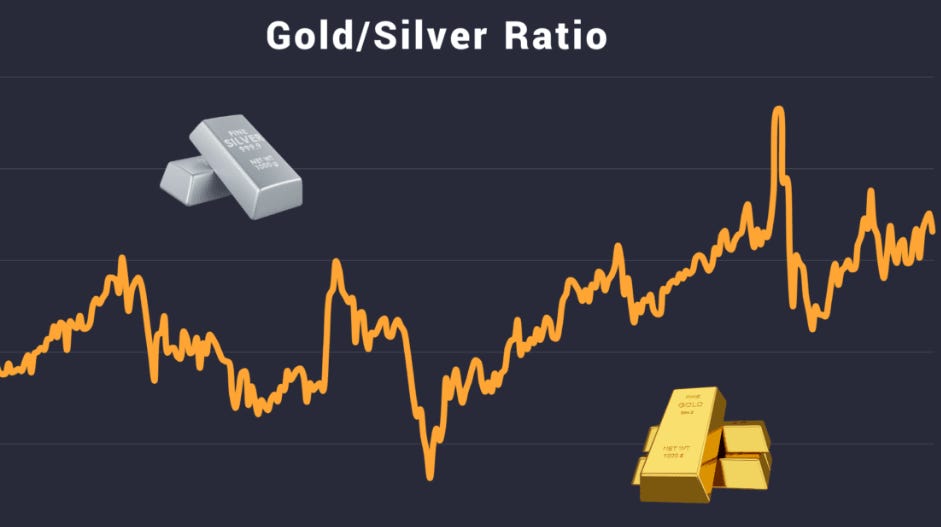
As of early December, 2025, the gold-silver price ratio stands at approximately 72:1, with gold trading around $4,220 per ounce and silver at $58.60. This metric, which tracks how many ounces of silver buy one ounce of gold, has varied widely over the past century, influenced by economic shifts, supply dynamics, and demand patterns.
Over the last 100 years, the ratio has shown marked volatility, averaging about 50:1 in the 20th century before rising to 60-80:1 in recent decades. It stood at around 30:1 in the 1920s, surged to nearly 100:1 during the Great Depression and World War II in the 1930s-1940s due to gold re-valuations and scarcity fears, then declined to 40-60:1 post-WWII amid improving economic stability. The inflationary 1970s saw compressions to lows of 20-30:1 driven by silver speculation and monetary unrest, while the 1980s-1990s brought expansions to 50-80:1 with gold’s safe-haven appeal. In the 21st century, it averaged 60:1 but spiked to 86:1 in 2020 during the pandemic, reflecting risk aversion, before moderating to 72:1 today as silver benefits from industrial recovery.
These swings highlight gold’s monetary resilience versus silver’s sensitivity to growth cycles.
How does the price ratio compare with the metals’ natural abundance ?
Silver is roughly 20 times more abundant in Earth’s crust than gold, with concentrations of about 0.08 parts per million (ppm) for silver and 0.004 ppm for gold. Despite this suggested “natural” ratio of around 20:1, market prices often elevate it to 50-80:1, underscoring gold’s premium as a store of value.
Another variable at play is the utility of the two metals. Gold’s demand splits roughly 50% jewellery, 40% investment (including 537 metric tons for bars/coins in Q3 2025), and 10% tech/medical. Silver, more industrially oriented, splits 58% in applications like solar panels, EVs, and electronics, 25% jewellery, and 17% investment—driving its volatility amid green tech booms.
Possible Future Trajectories
Analysts project gold trading in the $4,000-$5,000 per ounce range throughout 2026, fuelled by central bank buying and geopolitical risks. Silver forecasts vary: base cases see $60, with bulls at $70-80 amid supply deficits of 200 million ounces annually, though some warn of dips to mid-$40s if industry softens. The ratio could compress toward 60:1 if silver’s dual-role demand surges, signalling undervaluation today—but the ratio could rise further in recessions. Mean reversion investors eye high ratios (>70:1) as silver-buying opportunities in a tightening market.
Regardless of how the ratio plays out, it is great to see renewed interest silver as a respectable industrial metal with a precious metal baseline.